


Numbers and time
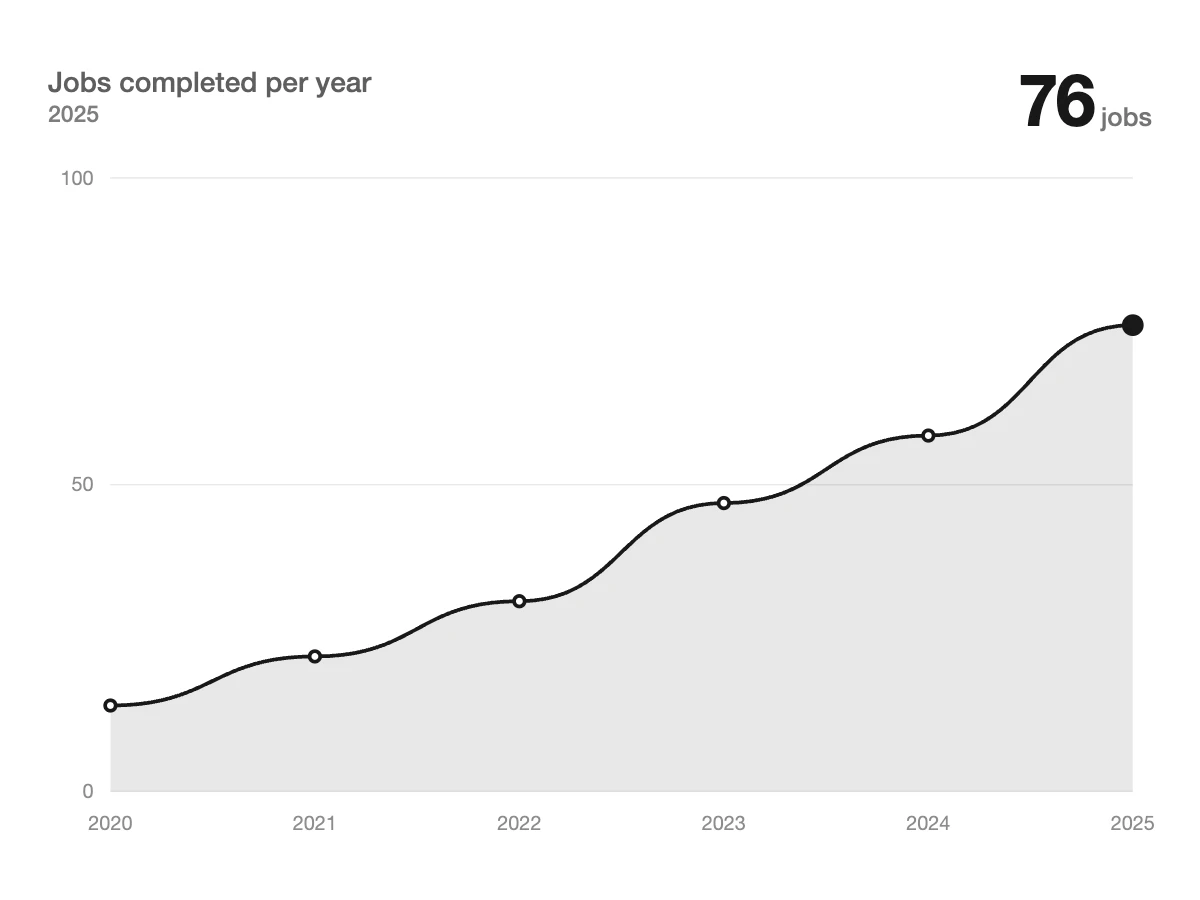
Chart that draws itself
A line or bars from your numbers draw from left to right on arrival. Hovering shows the value of each point.
UI LabsUse in the Editor

On Pro and MaxTry it on any plan
Your site’s coloursUses the colours your site has
Fast on phones tooLoads at its section, pauses off screen
Try it
See the changes in the effect above. In the Editor you set them the same way.
Site colours
Chart type
Colour
How to use the effect
- In the Editor, open Add section and choose Effect.
- Find the “Chart that draws itself” effect and click it. The section goes below the one you have selected.
- In the section panel on the right, adjust: chart title, values (label: number, …).